
Weak Breadth and Ex Tech

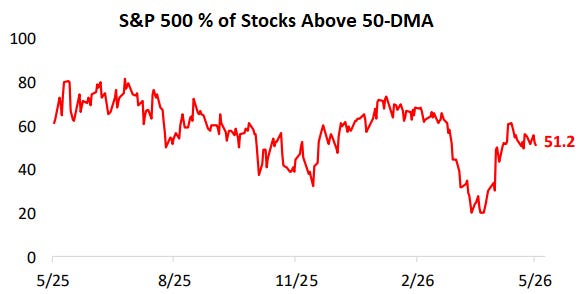
Even with the S&P 500 at all-time highs and 7% above its 50-day moving average, just 51.2% of stocks in the index were above their 50-DMAs to start this week. As shown below, this breadth reading has been severely depressed recently, highlighting the narrowness of the index’s surge to new highs (on the back of the hyperscalers and semis).
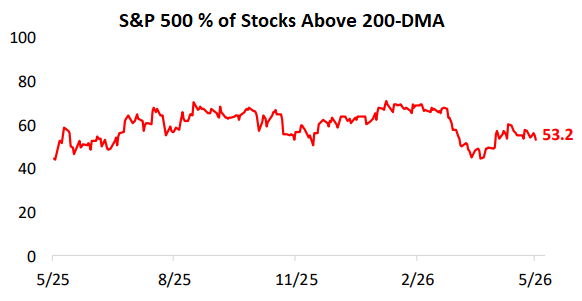
The percentage of S&P 500 stocks above their 200-day moving average isn’t much better at just 53.2%.
If all you saw were these two breadth charts, you’d think the market was mired in a slow bleed over the last few months rather than at record highs.
Below we take a look at where breadth readings normally sit when the market is at all-time highs.
