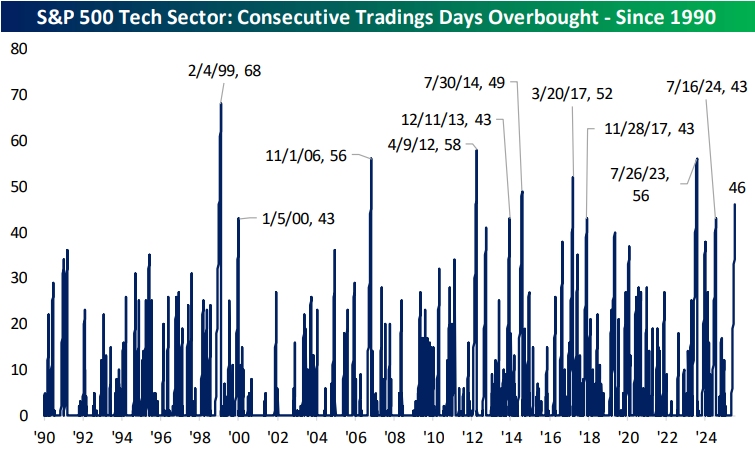
Tech Sector Overbought Streak
Below is a look at a one-year price chart of the S&P 500 Technology sector. The white line represents the sector's 50-day moving average, while the light blue shading represents its "normal" trading range, which is a band that's one standard deviation above and below the 50-DMA. The red shading is one to two standard deviations above the 50-DMA, which we consider "overbought" territory, and anything above the top of the red band is more than two standard deviations above the 50-day. The green shading is the opposite of the red zone: one to two standard deviations below the 50-DMA, which we consider "oversold."
The Tech sector has now rallied 45% since its low point in early April, leaving it at all-time highs. The sector has also now closed in "overbought" territory for 47 straight trading days through Friday.
This is the 11th time since 1990 that the Tech sector has closed in overbought territory for at least 40 straight trading days. Yesterday we looked at how the sector has done going forward after prior lengthy overbought streaks in our post-market macro note, The Closer. You can read that report with proper access here.
The longest the Tech sector has remained in overbought territory is the 68-trading day streak that ended in February 1999. At its current level, the sector would need to fall 3.5% for the "overbought" streak to end, so unless we get a big drop early next week, it looks like the current streak will make it to the 50-day mark.


